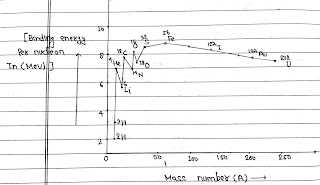
It is a plot of the binding energy per nucleon Ebn versus the mass number A for a large number of nuclei.
From Graph:
1. Average binding energy per nucleon for light nuclei like ₁H¹, ₁H², ₁H³ is small.
2. For mass numbers ranging from 2 to 20, there are sharply defined peaks corresponding to ₂He⁴, ₆C¹², ₈O¹⁶, etc. The peaks indicates that these nuclei are relatively more stable than the other nuclei in their neighbourhood.
3. The binding energy curve has broad maximum peak in the range A=30 to A=120, which is practically approx constant corresponding to average binding energy per nucleon is 8.8 MeV per nucleon for Fe(Iron).
4. As the mass number increases, the binding energy per nucleon decreases gradually falling to about 7.6 MeV per nucleon for U. The decrease may be due to coulomb repulsion between the protons. The heavy nuclei are therefore, relatively less stable.
Conclusion:
From the binding energy per nucleon curve, We able to know that which element will under go for fission and fussion.
# ₁H² +₁H²= ₂H⁴ + Energy(Released)
₁H² +₁H² will combine to give ₂H⁴ and release energy this process is called fussion.
# Uranium will split into Borium and krypton with the release of large amount of energy is called fission.

