
Hysteresis Curve:
NCERT Class 12th Physics || Chapter-5 || Magnetism and Matter:
The hysteresis Curve represent the relation between the magnetic induction B or intensity of magnetisation I of a ferromagnetic material with magnetic intensity H. The graph shows the behaviour of the material as we take it through one cycle of magnetisation.
Formation of hysteresis Curve:
1. We take an unmagnetised ferromagnetic material and keep it in a solenoid and increase the current through a solenoid that means magnetic intensity H.
As H increases, magnetisation I also increases until saturation is achieved.
That means all atomic dipoles are aligned with applied H (point a). On further increasing current there is no change in I as saturation is achieved.
So initially when current is 0, H=0 and I=0 at point O.
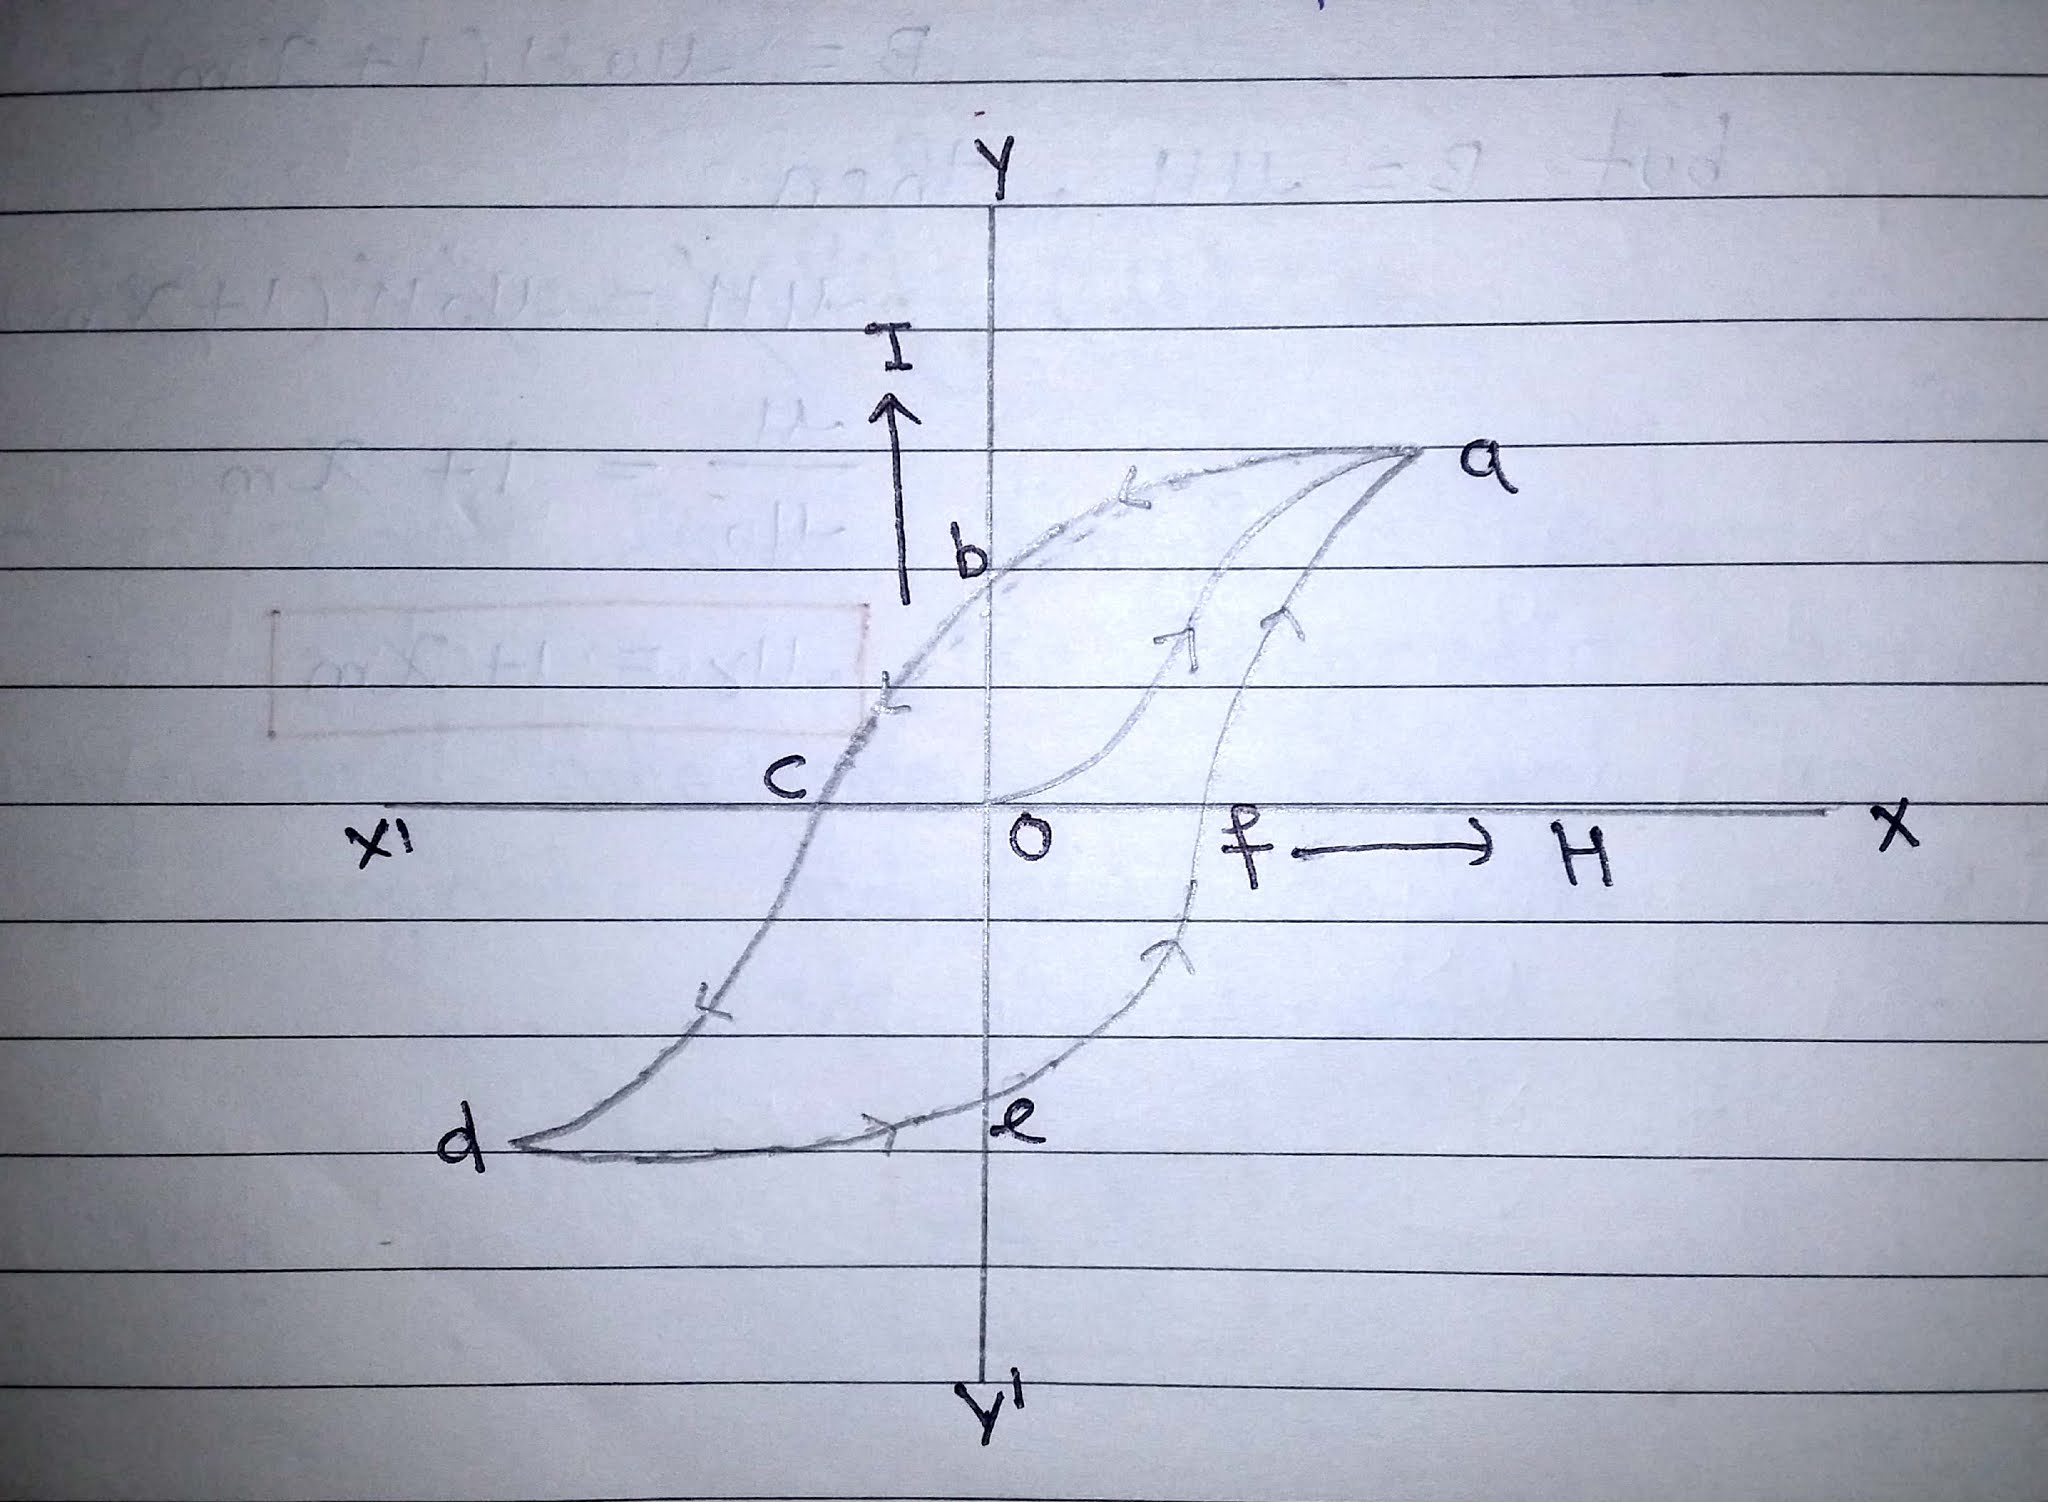
2. Now if we decrease current that is H decreases, I also decreases, But it is observed that even when current is reduced to zero but there is still some magnetisation left.
Retentivity:- Tendency to retain property of magnetisation even when external field is removed.
3. Now to make I=0 that is to bring dipole to original configuration, Opposite current is applied (H= -Ve). On increasing H in negative direction (at point c) I become 0.
This is called Coercitity.
Coercivity:- The amount of -Ve H required to make I=0.
4. Now if reversed current is increased (H increased in -Ve), Dipole starts alligning in opposite direction to original. Now dipole allign with -Ve H untill all dipoles are aligned and saturation is achieved, in opposite direction (at point d).
5. Again current is decreased to 0 (H=0) still I is not equal to zero (at point e).
6. Now if again we reversed to current in opposite direction(+Ve), (at point f), I=0.
7. On further increasing current, at same point a, I get saturated.
This whole curve is called Hysteresis Curve.